Installing OpenTelemetry
Before executing the command ./easy-monitor otel, verify the environment variables in the docker-compose.yml file. These variables are used to configure the OpenTelemetry Collector and other components of the monitoring stack.
Feel free to adjust these variables according to your needs. For example, you can change the ports, service names, or other environment-specific settings.
Open the file docker-compose.yml in a text editor, such as vim or vscode. You can use the following command to open docker-compose.yml in vim:
$ vim /opt/easy-monitor/otel/docker-compose.ymlStarting the OpenTelemetry Stack
To start the OpenTelemetry Collector, run the following command:
$ ./easy-monitor otel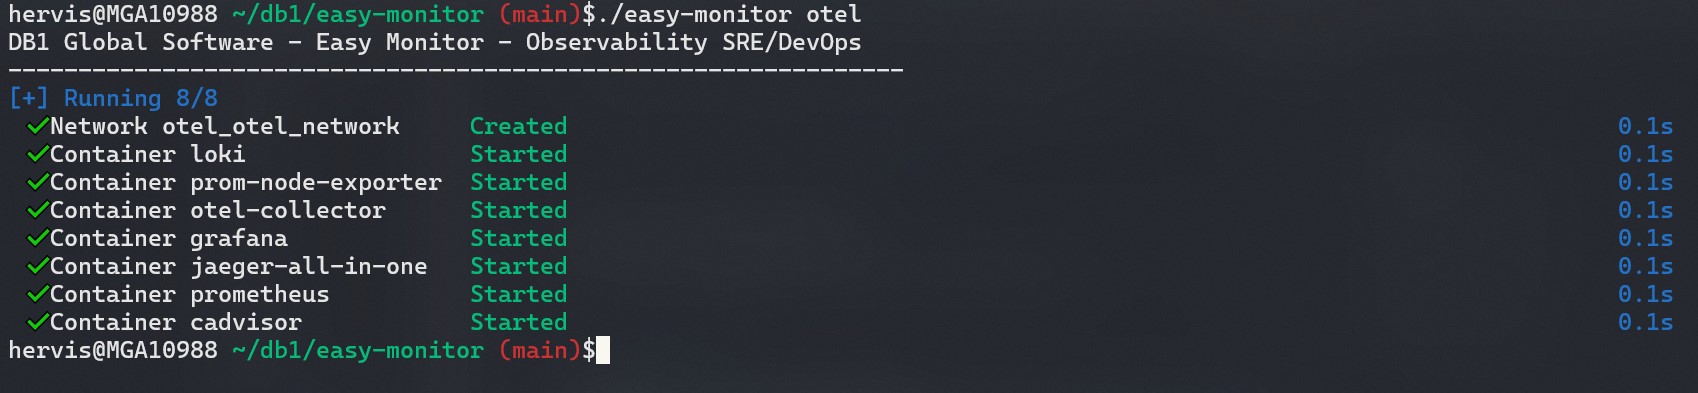
This command starts the OpenTelemetry stack. The stack is composed of the following components:
- Loki: A log management system that collects and stores logs from containers.
- OpenTelemetry Collector: An agent that collects, processes, and sends metrics and traces to the monitoring backend.
- Prometheus: A monitoring and alerting system that collects metrics from services and containers.
- Grafana: A data visualization and analysis platform that integrates with Prometheus to display metrics on dashboards.
- Jaeger: A distributed tracing system that collects and visualizes traces from microservices requests.
When executing $ ./easy-monitor otel, the script begins to configure the OpenTelemetry environment.
Checking the Containers
After completing the execution of the command ./easy-monitor otel up, check if the containers have started successfully:
$ docker container lsAccessing the Tools
Now that the OpenTelemetry stack is running, you can access the monitoring tools through the following URLs:
- Grafana: http://localhost:3000
- Prometheus: http://localhost:9090
- Jaeger: http://localhost:16686
Validating the OpenTelemetry Stack
Now that the OpenTelemetry stack is running, you can validate if everything is working correctly. Below are the steps to validate each component of the stack.
Validating Grafana
To validate Grafana, access the following URL: http://localhost:3000. The default username and password are admin/admin. After logging in, you will see the Grafana dashboard.
Sample Dashboard
In Easy Monitor, we have already included 2 sample dashboards for you to start visualizing metrics.
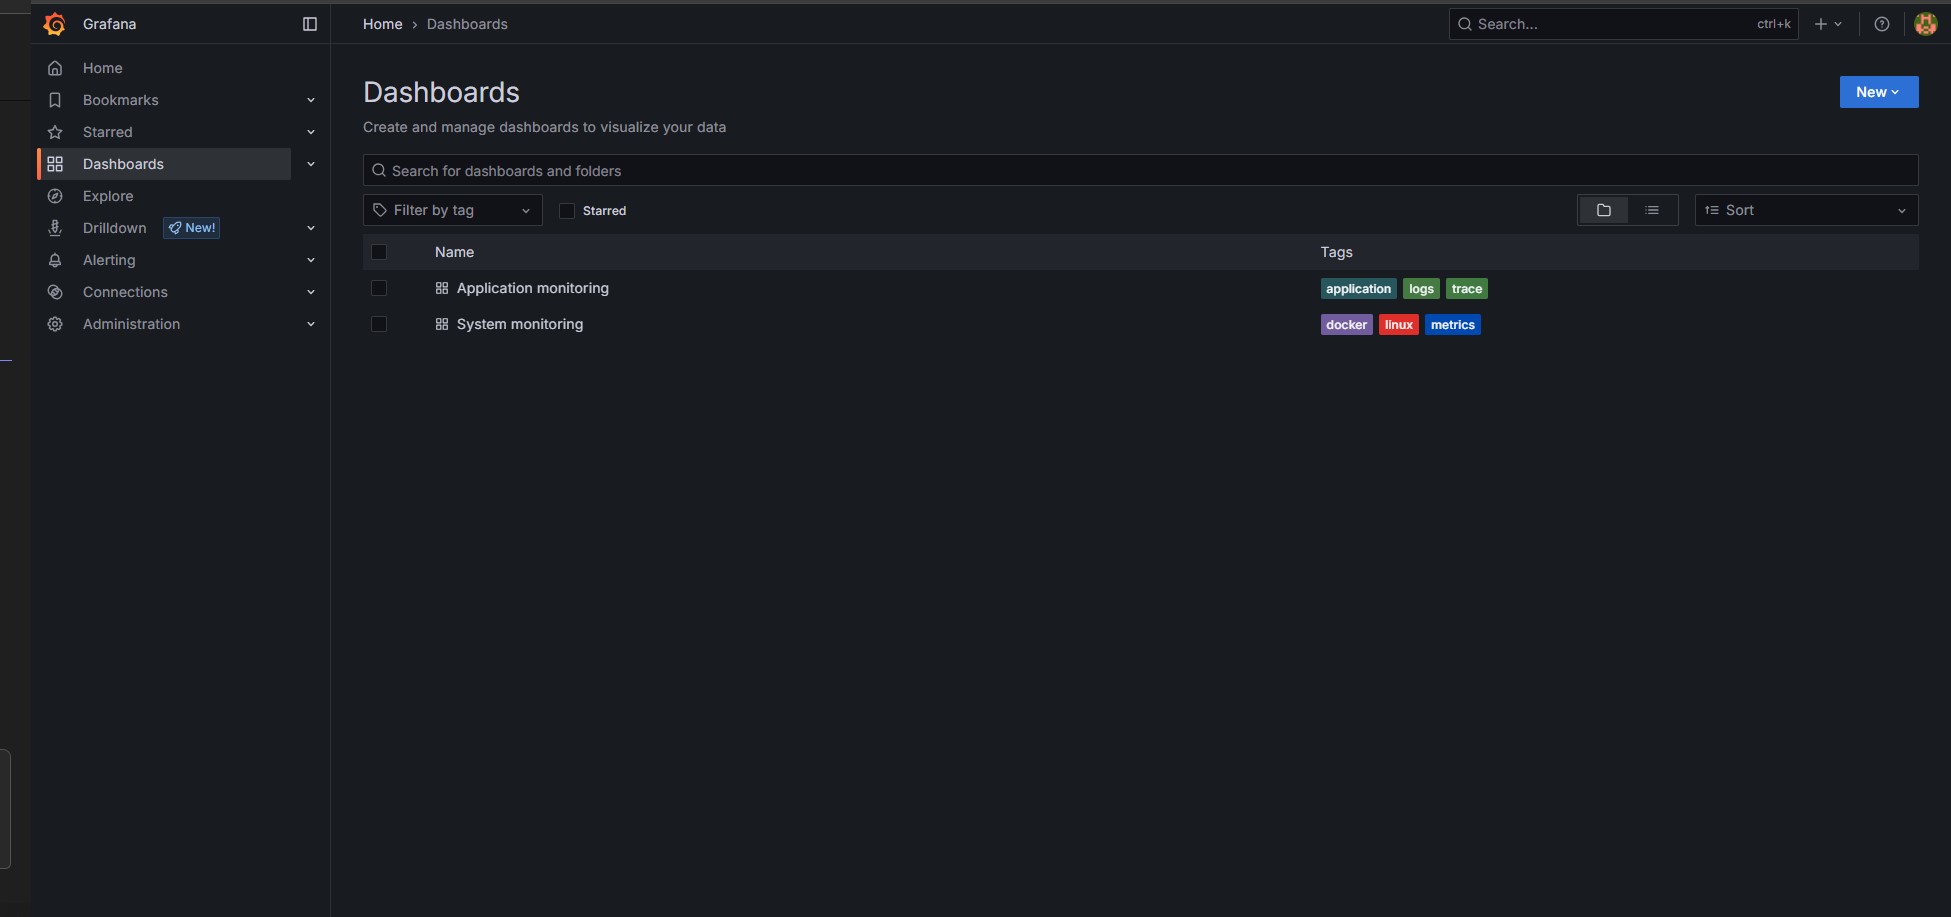
To access the dashboards, click on the dashboards icon in the left sidebar and select the desired dashboard. You will see charts and metrics collected by Prometheus.